Full-Funnel Dashboards
One truth across every channel.
Meta, Google, LinkedIn and TikTok pulled into a single live funnel — spend to revenue, blended and per-channel, refreshed continuously.
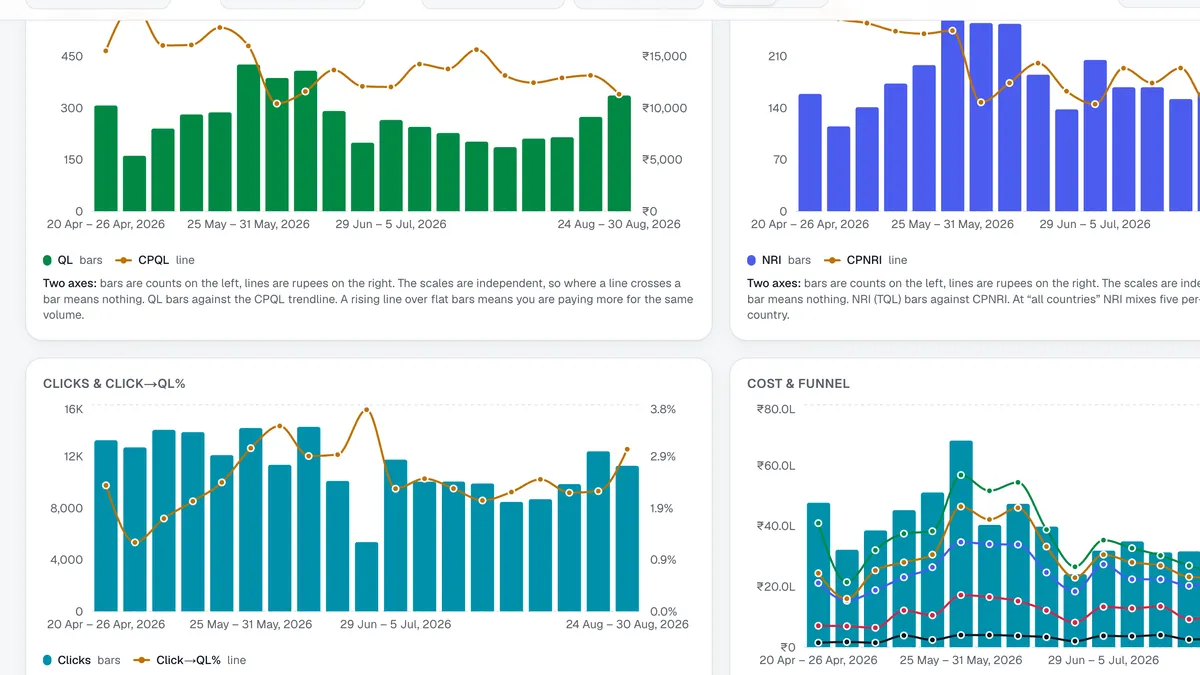
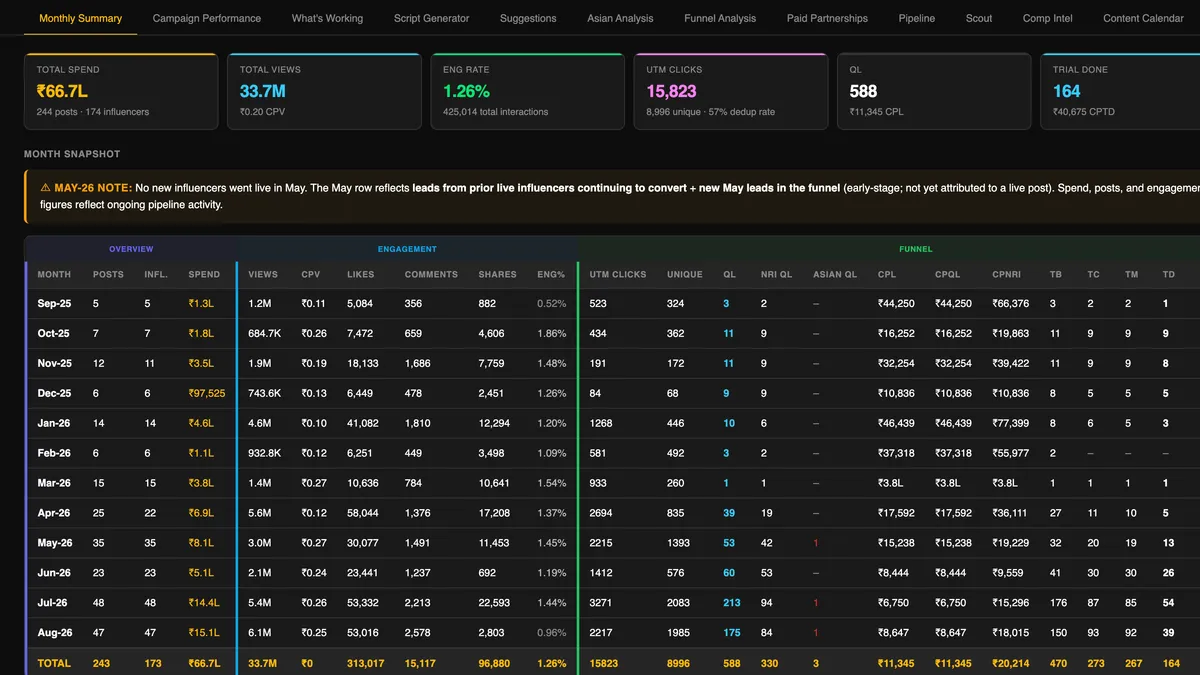
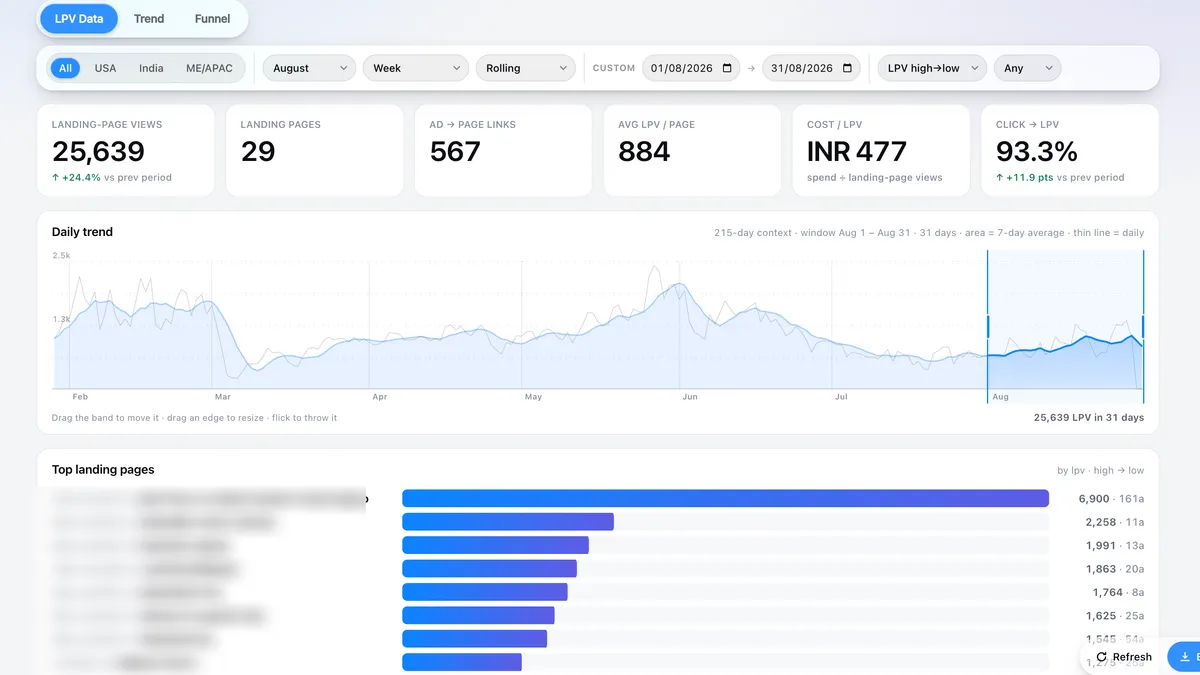
Full-Funnel Dashboards pull Meta, Google, LinkedIn and TikTok into one live funnel, from spend to revenue, blended and per channel, refreshed continuously. You get blended CAC and ROAS with per-channel splits, a click-to-revenue funnel view, anomaly alerts, and a plain-English weekly summary. It is the dashboard our operators work from.
-
The tension
Four platforms, four dashboards, four versions of the truth — and hours of export-and-stitch before anyone can answer "what’s actually working?"
-
The shift
One live view pulls every channel into a single funnel: spend to revenue, blended and per-channel, refreshed continuously. It's the same data layer our agents optimize against — so reporting and action never drift apart.
-
The outcome
Decisions in minutes, not Mondays. Weekly plain-English readouts — no dashboard archaeology.
What you get
Concrete, not fluff.
-
Cross-channel live dashboard
-
Blended CAC and ROAS with per-channel splits
-
Funnel-stage view from click to revenue
-
Anomaly alerts before they are line items
-
Plain-English weekly summary
How it works
Brief in, live campaign out.
-
Connect channels
-
Unify the funnel
-
Watch continuously
-
Flag anomalies
-
Feed the optimizer
The proof
Lead with one number. Drill down on demand.
Alerts firing and getting resolved while the blended number holds steady — the dashboard our own operators work from.
A mid-size US e-commerce business cut weekly reporting from around six hours to almost nothing, and an alert caught a pacing fault quietly burning roughly $1.5k a week. Directional, not a named client.
FAQ
Frequently asked questions
-
The major ad platforms, the common analytics tools and most CRMs. If something in your stack is unusual, the integration work is scoped before you commit rather than discovered afterwards.
-
By de-duplicating against a single source of truth, usually your CRM or store. Platform-reported numbers are kept visible so you can see the gap, but the blended figures do not double-count.
-
It is a view, not a workflow. Nobody has to move their work into it. It exists so the weekly question — is everything okay — has one answer instead of six.
-
Yes. It is the same dashboard our operators work from, with the same numbers. If we are looking at something you cannot see, the setup is wrong.